Zelda played the Adventures of Math game on August 1 and scored points. She continued to play daily over the next days. The bar chart below shows the daily change in her score compared to the day before. (For example, Zelda's score on August 2 was points.) What was Zelda's average score in points over the days? 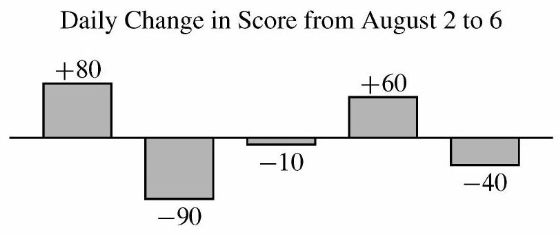
- A)
- B)
- C)
- D)
- E)
Answer
E
Key insight
Track deviations from 1700: the six scores are 1700 + (0, 80, −10, −20, 40, 0), and the deviations average 90/6 = 15, so the mean is 1715.
Solution
The bars give the day-to-day changes for August 2 through 6. Accumulate them starting from :
| Aug 1 | Aug 2 | Aug 3 | Aug 4 | Aug 5 | Aug 6 |
|---|---|---|---|---|---|
| 1700 | 1780 | 1690 | 1680 | 1740 | 1700 |
Rather than adding six four-digit numbers, add the amounts above : . Spread over days that is per day, so the average score is .
The answer is .
Why this works
A chart of changes must be turned into actual values by a running total before averaging. Subtracting a convenient baseline from every value does not change how far the mean is from that baseline, which keeps the arithmetic to single- and double-digit numbers.
The trap
Reading each bar as the score's difference from 1700 rather than from the previous day, or averaging only the five later days.
Common mistakes
- Reading each bar as the score's difference from 1700 rather than from the previous day, or averaging only the five later days.
- Adding the changes and dividing by (the number of bars) instead of (the number of days).
Techniques
Set up the equation/formula and compute; no special trick needed